

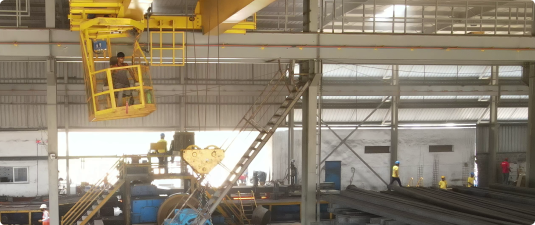
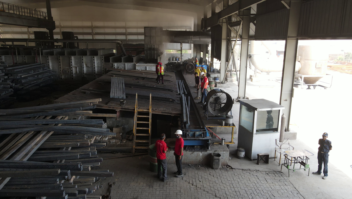
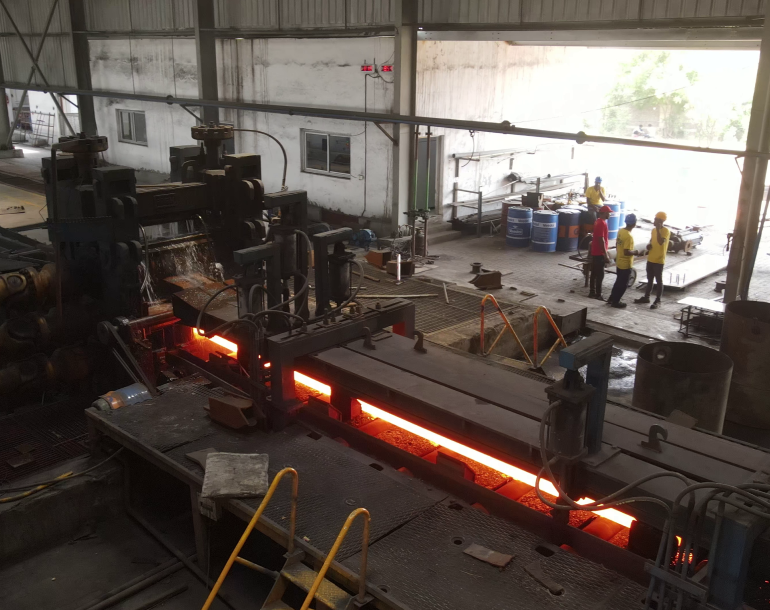
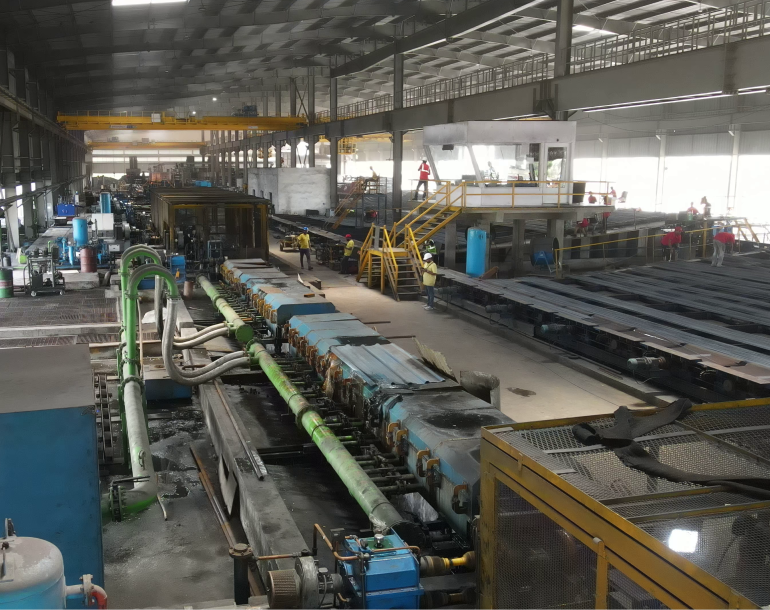
Billets travel from continuous casting machine to roughing mill through the cooling bed. The roughing mill is where most of the elongation is done and the area cross section gradually decreases and the length increases. But the Billet is still in the heated state and it continuously moves on to the next rollers through the guideways. To move the hot billet to the next rollers some accelerators are placed at certain intervals. These are called pinch rolls. There are springs on these pinch rolls which puts the pressure on the moving rod. The guideways help the tip of the red hot rod to enter the next roller that is the intermediate mill.
After passing through the roughing mill, the rod is led into the Intermediate mill. There is a speed increaser placed for the smooth movement of the rod as the motor is incapable of giving the entire push to the rod. After the intermediate mill, two pinch rolls and a shearer is placed before the finishing mill to make the movement of rod smooth. There are front and back cutters which remove the front and back tip of the hot rod to allow proper entering into the finishing mill.
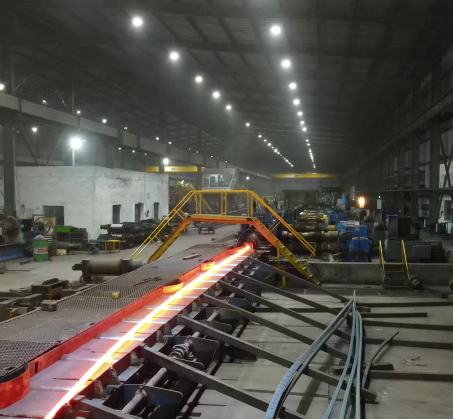
One of the most important parts of the plant is the TMT box where all finished stand TMT are passed through. When the hot reinforced bar leaves the final rolling mill stand, it is instantaneously quenched – a type of heat treatment where the bars are rapidly cooled by water in a quenching box to obtain certain material properties. Quenching prevents the occurrence of undesired processes such as phase transformations etc. It accomplishes this by reducing the time frame during which these undesired reactions have a higher chance of occurring. Apart from it, the sudden drastic change in temperature toughens the outer layer of the steel bar, thus enhancing its tensile strength and durability. Thus, the quenching converts the outer surface of the reinforced bar to Martensite, a hard form of steel and causes it to shrink, which in turn pressurizes the core, thus helping it to form the correct crystal structures. As a result of this process, the surface of the quenched bar becomes cold and hardened, while the core remains hot.
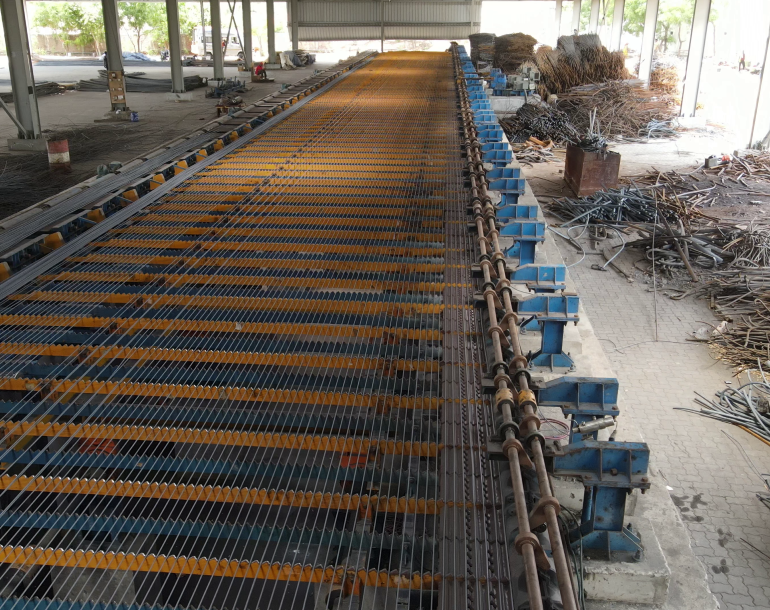
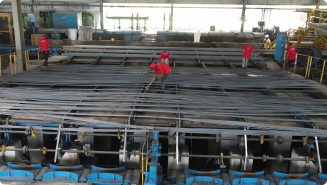
After the self-tempering process, the bars are subjected to atmospheric cooling to equalize the temperature difference between the soft inner core and the hardened exterior. Once the bars are completely cooled down, the austenitic core gets transformed into a ductile ferrite-pearlite structure. Automatic cooling bed with layered transfer.
After leaving the quenching box, a temperature gradient is formed through the cross-section of the quenched bar. As a result, heat flows from the core, as it is at a relatively higher temperature to the outer surface. This causes the correct tempering of the outer martensitic layer into a structure called Tempered Martensite and the formation of an intermediate ring of Martensite and Bainite (a plate-like microstructure). The core still stays in the austenitic (a typical cubical crystalline structure, commonly called as gamma-phase iron) state at this stage
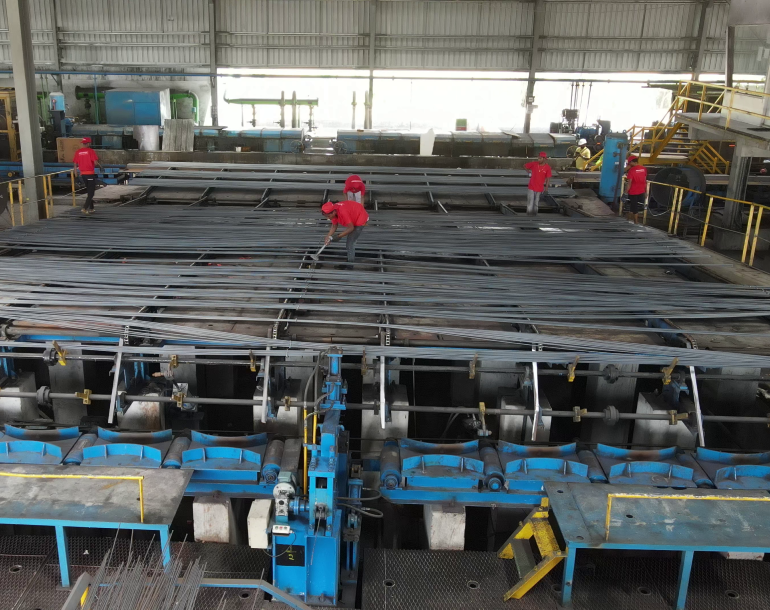
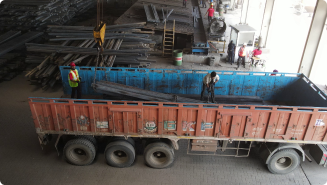
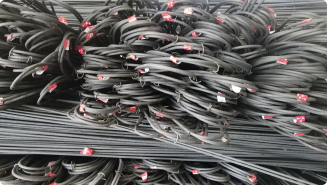
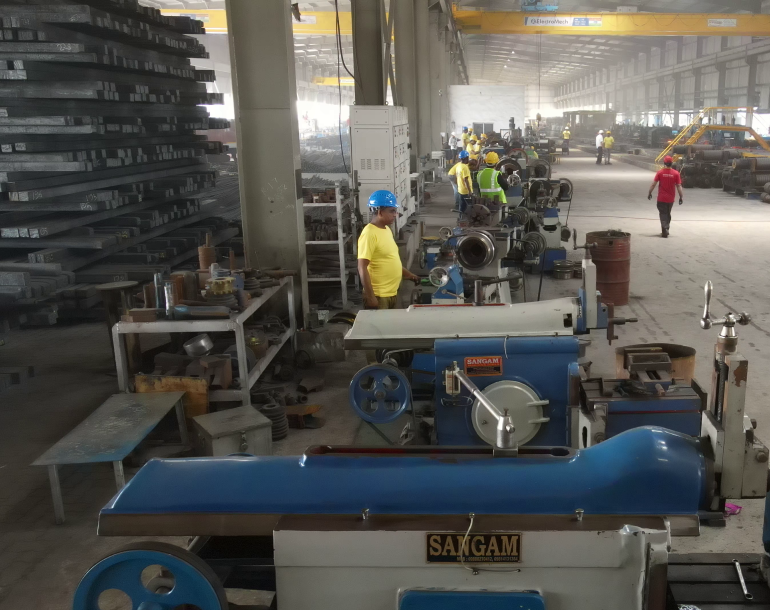
TMT bars forming are generally divided into shearing, bending and threading. The steel bar cutting production line adopts computer control technology, which ensures cutting of steel bar by auto-sizing. After cutting off by flying shear, the steel bar is moved to the designated storage rack and stored according to the specifications.
Billets travel from continuous casting machine to roughing mill through the cooling bed. The roughing mill is where most of the elongation is done and the area cross section gradually decreases and the length increases. But the Billet is still in the heated state and it continuously moves on to the next rollers through the guideways. To move the hot billet to the next rollers some accelerators are placed at certain intervals. These are called pinch rolls. There are springs on these pinch rolls which puts the pressure on the moving rod. The guideways help the tip of the red hot rod to enter the next roller that is the intermediate mill.
After passing through the roughing mill, the rod is led into the Intermediate mill. There is a speed increaser placed for the smooth movement of the rod as the motor is incapable of giving the entire push to the rod. After the intermediate mill, two pinch rolls and a shearer is placed before the finishing mill to make the movement of rod smooth. There are front and back cutters which remove the front and back tip of the hot rod to allow proper entering into the finishing mill.
One of the most important parts of the plant is the TMT box where all finished stand TMT are passed through. When the hot reinforced bar leaves the final rolling mill stand, it is instantaneously quenched – a type of heat treatment where the bars are rapidly cooled by water in a quenching box to obtain certain material properties. Quenching prevents the occurrence of undesired processes such as phase transformations etc. It accomplishes this by reducing the time frame during which these undesired reactions have a higher chance of occurring. Apart from it, the sudden drastic change in temperature toughens the outer layer of the steel bar, thus enhancing its tensile strength and durability. Thus, the quenching converts the outer surface of the reinforced bar to Martensite, a hard form of steel and causes it to shrink, which in turn pressurizes the core, thus helping it to form the correct crystal structures. As a result of this process, the surface of the quenched bar becomes cold and hardened, while the core remains hot.
After the self-tempering process, the bars are subjected to atmospheric cooling to equalize the temperature difference between the soft inner core and the hardened exterior. Once the bars are completely cooled down, the austenitic core gets transformed into a ductile ferrite-pearlite structure. Automatic cooling bed with layered transfer.
After leaving the quenching box, a temperature gradient is formed through the cross-section of the quenched bar. As a result, heat flows from the core, as it is at a relatively higher temperature to the outer surface. This causes the correct tempering of the outer martensitic layer into a structure called Tempered Martensite and the formation of an intermediate ring of Martensite and Bainite (a plate-like microstructure). The core still stays in the austenitic (a typical cubical crystalline structure, commonly called as gamma-phase iron) state at this stage
TMT bars forming are generally divided into shearing, bending and threading. The steel bar cutting production line adopts computer control technology, which ensures cutting of steel bar by auto-sizing. After cutting off by flying shear, the steel bar is moved to the designated storage rack and stored according to the specifications.